


Forecasting Fulfillment Capacity for Sales Spikes: How to Plan for Volume Surges
Sales surges can quickly overwhelm your fulfillment operation if you’re not prepared. This guide shows founders and ops leaders how to forecast fulfillment capacity for sales spikes with operator math, tight SLAs, and a flexible 3PL. That way, orders keep moving smoothly when volume jumps.

What “Forecasting Fulfillment Capacity for Sales Spikes” Means — and When to Use It
Forecasting fulfillment capacity for sales spikes is the process of matching expected order surges to the available resources and workflows that can ship them: people, stations, pick paths, inventory positioning, and carrier cutoffs. It’s about anticipating fluctuations and aligning your operations to meet spikes without sacrificing accuracy or speed.
When to Use It
Seasonal peaks: Q4 holiday season, back-to-school, gifting holidays like Valentine’s Day or Mother’s Day. These periods create predictable but intense order surges. Planning ahead safeguards service.
Promotions: Events such as sitewide sales, influencer and TV appearances, email/SMS drops, limited product releases, which generate sudden volume lifts. Being proactive mitigates chaos.
New channel or SKU launches: Expanding onto Amazon, retail purchase orders, wholesale onboarding can create unfamiliar volume patterns needing careful capacity alignment.
Volatility periods: Algorithmic boosts, viral social posts, or competitive moves often cause unpredictable surges. Having scenario plans helps keep pace.
Why It Matters
If done well, capacity forecasting reduces error rates, speeds cycle times, and lowers costly fire drills like overtime, temp labor premiums, and expedited freight. It also sets clear delivery expectations for marketing and customer service teams.
Skipping this step risks picking pileups with workers waiting idle or desperate packers starved for product. Inventory inaccuracies and stockouts tend to spike as rushed receiving and replenishment create holes. Carrier cutoffs are missed, pushing delays downstream and compounding backlogs.
Proper forecasting is a foundational practice balancing cost, customer experience, and brand reputation in today’s DTC and retail ecosystems. For practical inventory planning insights: https://www.peoriapros.com/fulfillment/the-importance-of-inventory-planning-for-peak-season-fulfillment/

Step-by-Step Workflow to Forecast Fulfillment Capacity for Sales Spikes
This workflow is the SOP we use and recommend. It’s straightforward math combined with operational knowledge—not magic.
1) Build the Demand View
Baseline volume: Extract daily order volume (DOV) and lines per order (LPO) for the last 8–12 weeks to understand normal cadence and prior peaks. This gives your runway and reference points.
Flag previous peaks: Note promotional days, email sends, retail POs, influencer features; record lift percentages and decay curves (e.g., +180% lift Day 1, +90% Day 2, settling by Day 5). This helps model expected volumes during similar future events.
Product mix insights: Identify which SKUs drive volume, unit of measure (each, inner pack, case), and any special handling needs such as fragile or oversize items. This impacts slotting, material handling, and labor assignment.
External signals: Integrate marketing calendar, ad spend, competitor promos, seasonality, and known inventory constraints. More on forecasting tooling: https://anchanto.com/demand-forecasting-with-wms/
2) Scenario Planning (Best/Base/Worst)
Base case: Marketing plan executes as expected.
Upside: Account for +25–50% order lift from unexpected press mentions or social virality.
Downside: Expect –20% if a launch is delayed or stock arrives late.
Assign trigger points to switch scenarios. For example, if DOV exceeds base by 20% for two consecutive days, activate the Upside labor and resource plan. Scenario planning reference: https://gainsystems.com/blog/importance-of-scenario-planning-in-building-a-demand-plan/
3) Use Forecasting Tools Carefully
Warehouse Management Systems (WMS) and dedicated forecasting software can help identify trends but beware of blind spots. Overreliance on black-box AI models that ignore SKU constraints, active promotions, or carrier cutoff times can be costly.
Sanity-check forecasts: Does the mix align with inventory receipts and inbound schedules?
Sanity-check forecasts: Are pick-face capacities sufficient for your top SKUs?
Sanity-check forecasts: Are line-per-order and product mix assumptions realistic?
Additional capacity planning perspective: https://cart.com/blog/order-fulfillment-capacity-planning
4) Translate the Forecast into Operational Units
Fulfilling orders requires labor planning based on touches, not raw order count.
Operational translation table (example):
Orders per day (OPD): 6,000 orders. Calculation: Known/forecasted demand.
Lines per order (LPO): 2.2 lines/order. Calculation: Historical average.
Total lines per day (LPD): 13,200 lines. Calculation: OPD × LPO.
Single-line singles ratio: 40% = 2,400 orders. Calculation: Portion that are simple, single SKUs.
Multi-line orders: 3,600 orders × 3 lines = 10,800 lines.
Kitting demand: 1,500 kits/day. Calculation: Based on forecast and historicals.
Add replenishment tasks based on pick-face depletion, receiving volumes inbound, and packing touches (inserts, gift wrap, return materials).
5) Capacity Math (Tune to Your Operation)
Adjust these sample rates to your specific warehouse and labor capabilities.
Rate table (typical ranges):
Single-line batch picking: 150–250 orders/hour/picker. Notes: Fast picking for simple SKUs.
Multi-line piece picking: 80–140 lines/hour/picker. Notes: Depends on slotting and pick paths.
Case picking: 120–200 cases/hour. Notes: Larger units, less SKU complexity.
Replenishment: 30–50 tasks/hour. Notes: Includes walking and putaway.
Packing (simple – poly bag, 1 insert): 80–120 orders/hour/packer. Notes: Light packing.
Packing (complex – rigid box, 3+ inserts, QC): 35–60 orders/hour/packer. Notes: Requires more quality control.
Kitting (light – 2–3 components): 120–250 kits/hour/assembler. Notes: Simple assemblies.
Kitting (complex – 5–10 components + QC): 40–120 kits/hour/assembler. Notes: Higher complexity and quality checks.
Receiving dock-to-stock: 20–30 pallets/hour/door. Notes: With clean PO and ASN.
Example Staffing for 6,000 Orders/Day
Pickers needed: Single-line singles picking: 2,400 orders ÷ 200/hour ≈ 12 picker-hours.
Pickers needed: Multi-line picking: 10,800 lines ÷ 110/hour ≈ 98 picker-hours.
Pickers needed: Total picking ≈ 110 picker-hours. On a 10-hour shift, ~11 pickers plus 20–30% buffer for breaks and exceptions.
Packers needed: 70% simple: 4,200 orders ÷ 100/hour = 42 packer-hours.
Packers needed: 30% complex: 1,800 orders ÷ 50/hour = 36 packer-hours.
Packers needed: Total packing ≈ 78 packer-hours, ~8 packers per 10-hour shift + buffer.
Replenishment specialists: Plan for 1–2 specialists based on tasks related to top 50 SKUs (~40–60 replenishment tasks per day).
Assemblers for kitting: 1,500 kits/day ÷ 150 kits/hour = ~10 assembler-hours — about 1–2 assemblers with setup and QC time.
Receiving: 60 pallets per day with advance shipping notices; 2–3 receivers to hit <4-hour dock-to-stock SLA.
6) Fix Slotting and Staging Before Adding Heads
Slot “A-mover” SKUs densely, waist-level, and near pack-out zones to shorten travel and raise lines per hour.
Pre-stage promo inserts and marketing materials at each packing station — avoid packers walking to fetch inserts.
Expand pick-face capacity for the top SKUs to prevent afternoon replenishment bottlenecks around peak hours (e.g., 2 p.m.).
Pre-build kits in daily waves against forecast; count and stage kits daily, rather than waiting until total volume is reached.
7) Plan Labor and Schedule Shifts
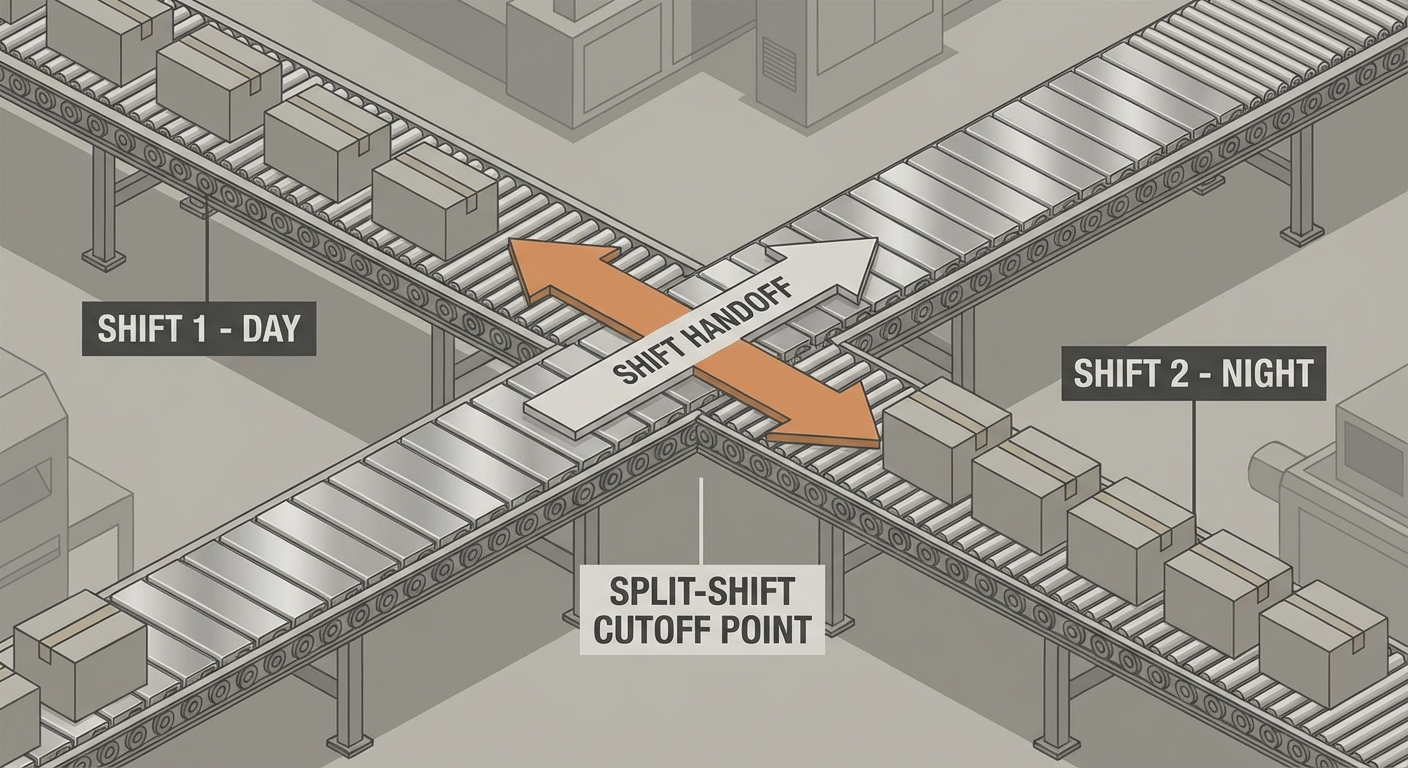
Extend shipping windows with split shifts aligned with carrier and cutoff times to flatten peaks and protect same-day transit promises.
Maintain an appropriate line-lead ratio (typically 1 supervisor per 8–12 floor staff) to control quality and flow during surges.
Cross-train labor: at least 30% of pickers capable of packing, and 20% of packers trained in replenishment.
Maintain a temporary labor bench: keep 2–3 vetted temp agencies on call; avoid using day-one temps in QC roles to protect accuracy.
8) Lock SLAs and Operating Rules
Set clear order cutoff times per service level. For example, orders placed before 2 p.m. ship same day; after cutoff ship next day.
Prioritize dock-to-stock processing of top movers within 4 hours of receipt.
Define escalation rules: unresolved exceptions after 2 hours escalate to supervisors.
Communicate carrier closeout and trailer spotting times transparently to marketing and customer service teams so expectations align.
9) Daily Cadence and Revision
Morning huddle (9 a.m.): Review yesterday’s throughput, today’s order forecast, and any open constraints.
Afternoon check-in (2 p.m.): Assess fulfillment velocity against plan; redeploy floaters or adjust labor where bottlenecks appear.
End-of-day review: Analyze root causes for missed targets—inventory issues, replenishment delays, WMS exceptions, or labor shortages—for continuous improvement.

Key SLA and KPI Metrics for Managing Sales Spikes
KPI table:
Pick accuracy: Target 99.8%+. Notes: Scan every pick; hourly audit of top SKUs.
Order cycle time: Target <24 hours. Notes: From order creation through carrier manifest.
Dock-to-stock time: Target <4 hours (priority SKUs); <24 hours (others). Notes: Inventory availability drives fulfillment speed.
On-time ship rate: Target 98%+. Notes: Measured against promised SLA, not just label printing time.
Inventory accuracy: Target 99.5%+ at pick-face. Notes: Daily cycle counts for A-movers; replenish early to avoid stockouts.
Throughput per labor hour (TPH): Target track by function. Notes: Lines picked/hour, orders packed/hour, kits built/hour; adjust labor allocation daily.
How All Points manages these KPIs: We operate a daily scorecard system by floor and function, using red/green SLA flags for quick visibility. Exception boards on the warehouse floor timestamp issues in real time, while root-cause logs tie missing KPIs back to WMS reason codes such as slotting mistakes, pick errors, damaged items, or system holds.

Pricing Drivers for Fulfillment Capacity During Peak Sales
Labor premiums: Overtime pay rates (typically 1.5x base), weekend shift differentials, temporary agency markup fees, and first-week reduced productivity from new temps.
Inbound handling: After-hours or rushed receiving appointments incur extra fees. Quality of advance shipping notices (ASN) impacts putaway accuracy and labor efficiency.
Space and staging: Temporary overflow storage or dedicated promotional staging zones require additional real estate and labor for management. Additional pick-face capacity for “A-movers” prevents replenishment delays but can increase facility needs.
Kitting complexity and inserts: More complicated kits and multiple marketing inserts add assembly and quality control time, reducing throughput rates. Pre-staging inserts can mitigate some costs.
Technology and configuration: Changes to WMS rules, wave logic, cartonization, or EDI workflows needed to support promotional surges create incremental tech expenses.
Packaging and freight: Special dunnage, branded boxes, or dimensional weight penalties during peak parcel surcharges raise packing and freight costs. These are often external to 3PL fees but should factor into total delivered cost.
Risks of Poor Forecasting—and How to Mitigate Them
Risk/mitigation table:
Labor scramble missing bottlenecks: Identify daily constraints (picking, replenishment, packing, receiving); redeploy cross-trained floaters; don’t add pickers where pack stations are capped.
Pick-face outages on A-movers at peak: Increase pick-face capacity; trigger replenishment earlier at 30–40% inventory rather than 10% minimums.
Backlogs compounding after carrier misses: Extend labor shifts to reach cutoff; stage next-day waves overnight; pre-label shipments to ease morning workflow.
Error spikes from rushed temp training: Keep temps off QC for first 3–5 shifts; enforce scan validation on every pick and pack step.
Stockouts from poor inbound planning: Tie demand forecasts to purchase order receipt schedules; require accurate ASNs; prioritize dock-to-stock processing within 4 hours of receipt for top SKUs.
WMS rules out of sync with promo logic: Conduct dry-run waves pre-launch; sandbox test cartonization and exception handling; revert changes rapidly if issues arise.
Peak season best practices case study: https://www.qualfon.com/case-studies/on-demand-fulfillment-peak-season/
The Atlanta Advantage for Sales Spike Fulfillment
Two-day ground reach: All Points’ Atlanta facility delivers to roughly 80% of U.S. customers within two days, enabling rapid replenishment and regional surge coverage without costly air freight premiums.
Carrier density: Multiple daily pickups and later regional cutoff times than remote locations help keep the floor clear and shipments flowing through peak volumes.
Inbound speed: Access to major port and domestic supplier corridors enables faster receiving, shrinking out-of-stock windows and replenishment delays.
Centralized kitting and printing: Housing kitting and marketing insert printing under one roof reduces handoffs, errors, and time-to-ship during high-volume campaigns.
Practical agility: With a smaller footprint than massive 3PL hubs, All Points can re-slot zones or adjust workflows rapidly, sometimes within a single week—something large operations can only do quarterly or later.
What You Get with All Points
Experienced operator-led planning and execution: Forecast-informed labor plans, slotting optimizations, and wave rules that hold under peak pressure.
Custom kitting and assembly services: We assemble complex kits and stage promotional inserts at the same facility. Learn more: /services/kitting-assembly
E-commerce fulfillment that scales: From batching and cluster picking to SLA-driven ship promises, our services provide both reliability and transparency. Learn more: /services/e-commerce-order-fulfillment
Warehousing and distribution: We support velocity through smart slotting, disciplined replenishment, and rapid dock-to-stock execution. Learn more: /services/warehousing-distribution
On-site printing and marketing materials: Bring creative, print production, and fulfillment together to reduce errors and speed ship times. Learn more: /services/printing-marketing-materials
All Points operates with daily performance cadences, proactive exception management, and clear operational cutoffs. Based in Atlanta since 1995, we have decades of experience taming messy surges and turning them into smooth, predictable fulfillment.
Primary CTA
Get a kitting quote: /services/kitting-assembly
Secondary CTA
Download our comprehensive 3PL Guide for e-commerce and Amazon sellers: https://www.allpointsatl.com/resources/3pl-guide-for-e-commerce-and-amazon-sellers
FAQ
How accurate should my sales spike forecast be for effective fulfillment?
A daily variance of +/- 10–15% is manageable if labor buffers like cross-training and pick-face expansions are in place. Precision matters less than having triggers and flexibility to scale mid-week as volumes change.
What SLAs can I set with a 3PL during peak sales periods?
Common SLAs include: same-day shipping for orders before cutoff; next-day shipping otherwise; dock-to-stock within 4 hours for priority SKUs; 98%+ on-time ship rate; 99.8%+ pick accuracy. Put these agreements in writing including clear definitions and reporting cadence.
How does All Points support labor scaling when order volumes spike?
We schedule split shifts around carrier cutoffs, maintain a vetted temp labor bench, cross-train staff for flexible role coverage, and provide line leads to rebalance labor twice daily based on throughput data.
What are common pricing factors for fulfillment during sales surges?
Overtime premiums, temp agency fees, rush receiving charges, staging and overflow space costs, kitting and QC complexity, specialized packaging, software configuration for promo logic and reporting are typical contributors.
How fast can customers receive orders from your Atlanta facility?
Our Atlanta hub covers roughly 80% of U.S. customers within two-day ground transit. Actual times depend on carrier and service level, but we coordinate cutoffs and pickups to maintain these promises during peak surges.
Implementation Checklist (Use Before Your Next Surge)
Finalize promotional calendar and expected volume lifts (base/upside/downside).
Confirm top 50 order-driving SKUs and schedule inbound deliveries with ASN quality control.
Re-slot A-movers densely; expand pick-face capacity; pre-stage inserts and dunnage at packing stations.
Pre-build kits daily in waves with QA countersignatures.
Publish SLAs, order cutoffs, and escalation procedures to marketing and customer service teams.
Build and staff labor plans by function with buffer shifts; confirm temp agency availability.
Dry-run WMS picking waves; validate cartonization and handle exceptions pre-launch.
Start daily operational huddles and institute scorecards; set triggers for switching forecast scenarios and labor activation.
Meta Title
Forecasting fulfillment capacity for sales spikes | All Points Atlanta 3PL
Meta Description
Practical, operator-level steps to forecast fulfillment capacity for sales spikes. Translate demand into labor, slotting, kitting, and SLAs. Atlanta-based 3PL since 1995.
Disclaimer
The information provided in this article is for general guidance only. Specific operational results may vary based on individual circumstances and changes in market conditions. All Points does not guarantee performance outcomes and recommends consultation for tailored fulfillment strategies.
Conclusion
Effectively forecasting fulfillment capacity for sales spikes helps you prepare labor, slotting, and SLAs to handle surges smoothly. Learn practical steps to align resources, reduce errors, and maintain speed—plus how All Points’ Atlanta 3PL offers scalable, precise fulfillment to keep your orders moving during peak demand.

.webp)
.webp)
.webp)
.webp)


