


How to Manage Returns Profitably at Scale: A Guide for DTC Brands and Retailers
Returns often blow up costs and slow down fulfillment for DTC brands and retail marketers. This guide breaks down how to manage returns profitably at scale through optimized reverse logistics, automation, and data-driven insights—so you reduce waste, recover value, and keep fulfillment smooth from intake to resale.
What “Managing Returns Profitably at Scale” Means and When to Use It
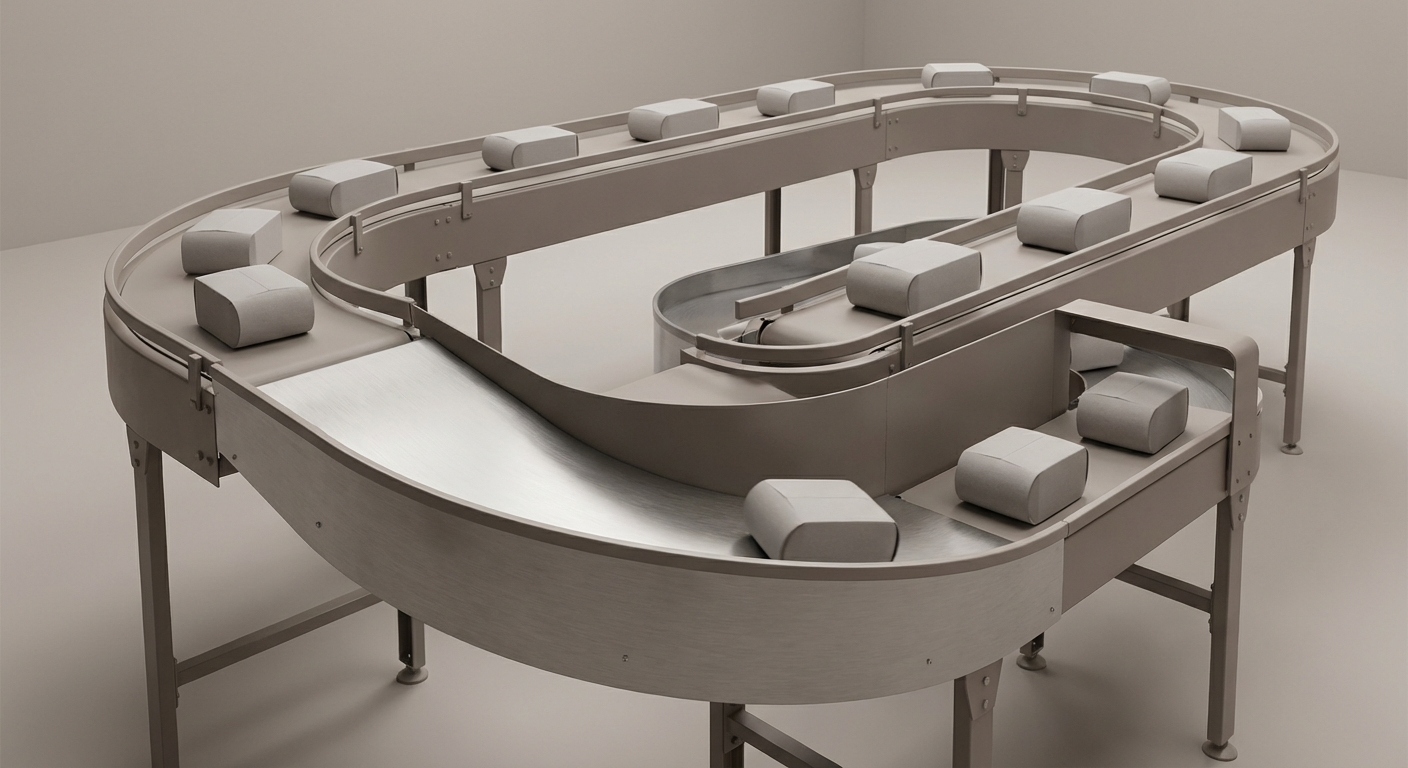
Managing returns profitably at scale means moving beyond treating returns as one-off headaches. Instead, you run them as repeatable, KPI-driven processes to minimize labor and time, move resalable units back to inventory quickly, and recover value on what can’t go back to A-stock. Rather than accepting returns simply as a cost center, this approach transforms the reverse supply chain into a competitive advantage, recapturing revenue and protecting margins.
This approach is essential when your return volume grows alongside your sales—typical for DTC brands, subscription box services, and ecommerce retailers handling high SKU volume. It involves implementing reverse logistics, recommerce, automation, and customer experience strategies that collectively reduce the impact on fulfillment while recapturing costs.
Use this playbook when:
- Your monthly returns exceed a few pallets or 3–5% of order volume, whichever comes first.
- SKU complexity is increasing with sizes, bundles, accessories, lot or expiry dates, or regulated goods.
- Returns clog receiving, delay putaway, or slow outbound on-time shipments.
- Inventory is split across DTC, marketplaces, and wholesale channels requiring consistent grading and disposition rules.
Core components include clear RMA rules and automation to reduce manual touches; standardized intake, condition grading, and repack SOPs; WMS-driven dispositions such as restock, refurbish, re-kitting, quarantine, donate/liquidate, or recycle; recommerce and secondary channel strategies for B- and C-grade goods; tight customer communications and refund SLAs aligned with actual processing speed; and data tracking on reason codes, return rates by SKU or size, unit recovery, and true cost per return.
This mindset transforms managing returns from a cost sink to a strategic lever for profitability and customer retention, particularly important as DTC brands and retailers scale operations amid rapidly growing ecommerce returns volumes (ReturnPro resource: https://www.returnpro.com/resources/blog/returns-management-reshaping-retail-profitability).
Step-by-Step Workflow to Manage Returns at Scale
1. Return Initiation and Authorization (RMA)
The foundation of a scalable returns program begins with clear policies and automated return authorization. Define explicit return windows (e.g., 30 days), condition standards, exclusions such as final sale or hazmat items, and restocking or label fees if applicable. Provide customers with a self-serve RMA portal where they enter reason codes, order numbers, and print instant return labels. Generate scannable RMA barcodes linked to original orders and SKUs to streamline intake and inspection.
When multiple fulfillment sites exist, route returns to the nearest capable node for processing efficiency. If not, centralize returns at a dedicated cell where staff specialize in inspection and grading. Exchanges require reserved inventory and cutoff rules to prevent overselling. Avoid auto-sending both return labels and replacements without restriction to reduce fraudulent returns.
2. Returns Intake and Inspection
Returns should be scheduled on separate dock lanes or appointment windows to avoid interfering with inbound purchase orders. On arrival, staff scan the RMA barcode to open returns in the Warehouse Management System (WMS). Returns arriving without RMAs go into quarantine until resolved.
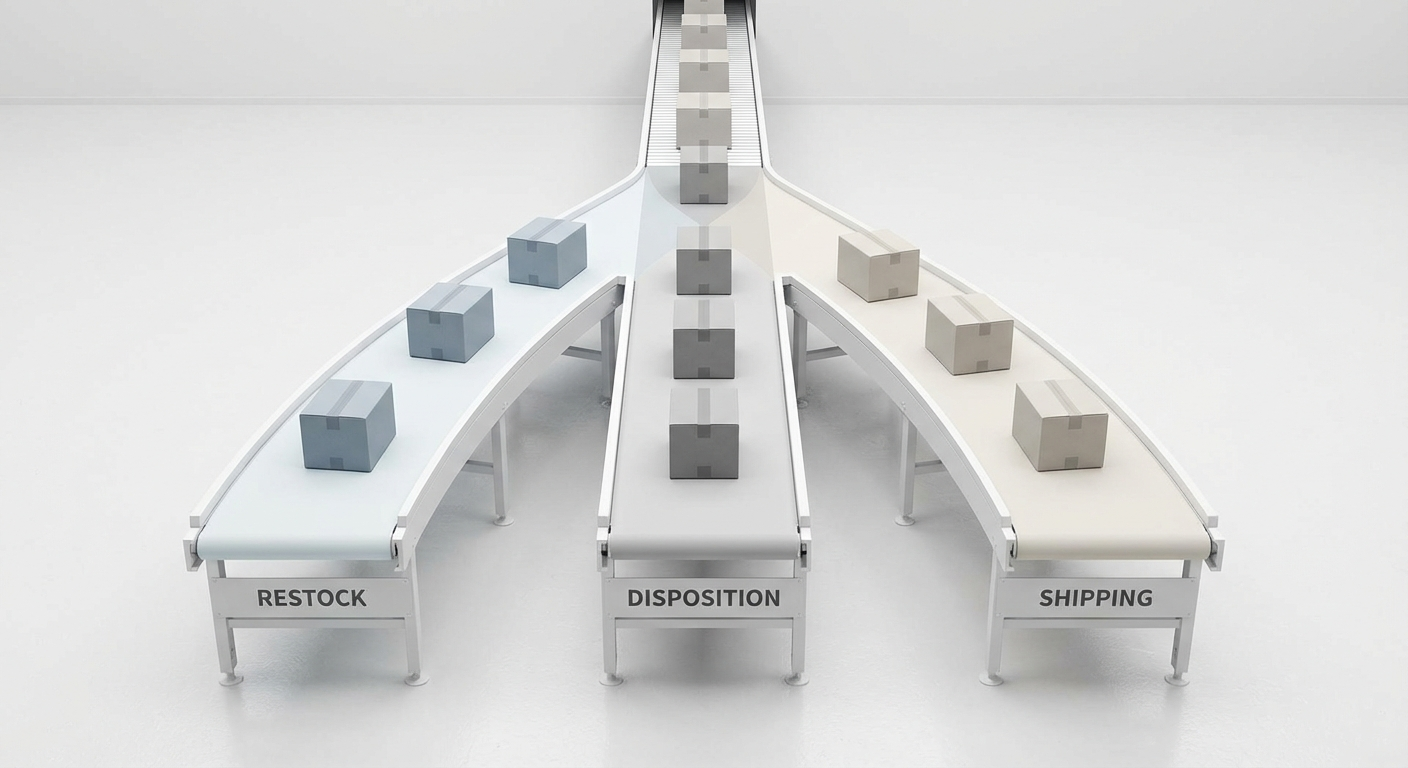
Create triage lanes categorizing items as A-stock restock, B-stock refurbish or repack, C-stock parts or open-box, quarantine for QC or compliance review, and non-recoverable stock for donations, liquidation, or recycling.
Grade returned items rigorously using category-specific SOPs. For apparel, check tags and hygiene seals; for electronics, run operational power tests and accessory audits; for cosmetics, verify packaging integrity and expiration dates. Capture photos documenting the condition and any defects, attaching images to the RMA record to protect against disputes.
Stock consumables like polybags, seals, desiccants, and labels at the returns cell to facilitate rapid repack and minimize item movement.
3. Reverse Logistics Routing and Disposition
After inspection, returned items take appropriate paths for their grade and condition:
- Restockable (A-grade): Items receive new barcodes if needed, are rebagged or repackaged, and staged for putaway—aiming for a dock-to-stock time within 24 hours to minimize inventory out-of-stock situations.
- Refurbish/Repack (B-grade): Simple refurbishing like cleaning, folding, and tagging occurs same day on the floor. More complex refurbishing (e.g., electronics testing or cosmetic sanitization) routes to specialized workbenches with defined SLAs.
- Re-Kitting: Replenish missing kit components or reconstruct full kits daily to avoid outbound kitting bottlenecks.
- Quarantine: Items needing warranty verification, regulatory compliance checks, or hazmat reviews are held with WMS flags blocking sale until cleared.
- Non-Recoverable: Manage donation or liquidation on a strict weekly schedule, logging inventory serials to prevent unauthorized remarketing.
4. Recommerce and Resale Handling
Develop distinct B- and C-grade SKU aliases for open-box or secondary condition returns to protect A-stock pricing integrity and forecasting. Define sales channel rules assigning inventory for Outlet websites, third-party marketplaces, or liquidation partners. Automate listings and pricing adjustments based on item grade and aging—for instance, setting prices starting at 70–85% of MSRP for like-new items, declining with time or condition.
Efficient recommerce integration turns returns into a revenue stream while reducing stock piling and depreciation risks (Radial insights: https://www.radial.com/eur/insights/how-to-turn-returns-into-profits).
5. Data Collection and Analysis
Require return reason codes at the time of RMA submission and validate these upon inspection. Track return data granularly by SKU, variant, size, and lot. Monitor return rates continuously to flag outliers for immediate attention and root cause analysis.
Calculate the true unit economics of returns by including labor, materials, inbound freight, and subtracting recovered resale value. Measure recovery rates as dollars regained per returned unit relative to COGS, segmented by disposition channel and product grade.
Cycle time metrics—time elapsed from carrier scan to disposition and from receipt to customer refund—provide SLA visibility and continuous improvement targets.
6. Customer Communication
Keep customers informed through automated status emails from label issuance, product transit, receipt, inspection, and refund or exchange completion. Publish refund timelines aligned to actual processing capacity and avoid overpromising same-day returns if inspection takes longer.
Use insights from return reasons to proactively refine sizing guides, reiterate packing standards, and adjust shipping carrier relationships to reduce repeated returns and enhance customer satisfaction (Sage blog on returns management: https://www.sage.com/en-us/blog/returns-management-process/).
Where Automation Pays Off
Automation reduces labor intensity and errors at every step:
- Automated RMA portals lower customer service load and issue instant labels.
- Barcode scanning integrated with the WMS prevents inventory mismatch and misclassification.
- Photo documentation defends against disputes and supports operator training.
- Rules-based disposition logic limits operator decision fatigue and variability.
- Exchanges prioritized over refunds help retain revenue and decrease returns frequency.
Returns Management KPIs and SLAs
Key Performance Indicator (KPI) | Target Value | Why It Matters
Return Pick Accuracy | ≥ 99.5% | Avoids additional rework and shipment errors
Return Processing Cycle Time | ≤ 48 hours from receipt | Minimizes hold-up of resalable inventory
Dock-to-Stock Time | ≤ 24 hours for reusable items | Speeds reintegration of stock to inventory
On-Time Customer Refund/Exchange | ≥ 95% within promised timeline | Enhances customer satisfaction and loyalty
Reason Code Capture Rate | ≥ 98% | Enables root-cause fixes for product and CX
Photo Capture Compliance | ≥ 95% of inspected returns | Protects against damage disputes and aids audits
Implementing strict SLAs empowers the team to maintain throughput while delivering a clear and efficient return experience. Meeting these KPIs reduces operational disruptions and fosters customer loyalty by ensuring timely refunds and exchanges (K38 Consulting insight: https://k38consulting.com/smart-product-returns-management/).

Pricing Drivers for Return Management
Understanding pricing drivers allows brands to forecast costs and identify savings opportunities:
- Return Volume and SKU Complexity: High return volumes and more SKU variants introduce more labor, complexity, and inspection time. Rates per return often decrease as process discipline improves and volumes stabilize.
- Condition Grading Requirements: Basic visual inspections are cost-effective, but products requiring electronics testing, sanitary validation, or lot and expiry checks increase handling time and complexity.
- Automation Level: Investments in RMA portals, WMS integration, conveyor systems, and barcode scanning greatly reduce per-return labor and errors, paying back upfront within months.
- Storage and Handling: B- and C-grade inventory occupies space with associated storage costs while awaiting resale or liquidation. Efficient scheduling of liquidation events reduces holding costs.
- Recommerce Partnerships: Fees, commissions, or revenue share models charged by recommerce or liquidation partners affect your net recovery, so selection and negotiation of partners is critical.
- Consumables and Repack Materials: Items like polybags, labels, hygienic seals, and inserts add per-return material costs. Standardizing sizes and materials cuts waste and handling time.
Disciplined process control and technology investment upfront lower the risk of unpredictable costs or hidden labor spikes throughout the returns lifecycle (Reveni blog: https://www.reveni.com/blog/the-relationship-between-profitability-and-returns-management).
Common Risks and How to Mitigate Them
- High Error Rates on Condition Grading: Staff errors cause misclassification and frustrate customers. Mitigate by applying operator training, layered quality control, photo documentation, and audit protocols.
- Inventory Misclassification: Integration of WMS and barcode scanning at every handling point prevents inventory drift and misplacement.
- Delays in Reverse Logistics: Setting clear cutoffs for returns acceptance and carrier SLAs prevents backlog accumulation.
- Unrecoverable Returns Stockpile: Regular liquidation cadence combined with a clear disposition strategy avoids aging inventory losses.
- Customer Frustration Due to Refund Delays: Automation combined with transparent communication avoids churn and builds trust.
- Returns Fraud and Abuse: Deploy photo checks, weight comparison, blacklist repeat offenders, and consider “keep it” policies for low-value items to reduce fraud costs.
- Holiday Aftermath at the Dock: Plan for post-holiday peaks with extra trained personnel, additional lanes, extended hours, and SOPs optimized for top-returned SKUs.
- Compliance and Regulatory Misses: Use category-specific SOPs, quarantine bins, and certified disposal partners for hazardous or expired goods.

The Atlanta Advantage for Returns Management
Location plays a decisive role in profitable returns management. Our Atlanta campus’s proximity to major parcel hubs and interstate corridors offers key benefits for reverse logistics:
- Faster inbound transit: Most U.S. addresses ship returns in 1–2 days, shrinking refund windows and accelerating dock-to-stock velocity.
- Wide regional reach: A two-day transit reach covers roughly 80% of the country, benefiting returns and outbound exchanges or recommerce sales.
- Consolidated operations: Returns intake operates alongside kitting, printing, and outbound workflows under one roof, reducing extra handoffs and lowering handling costs.
- Regional expertise: Carrier selection tailored to the Southeast market minimizes misroutes, delays, and reverse freight surcharges.
All Points combines infrastructure and knowledge to transform your returns program into an operational asset. Learn more: https://www.allpointsatl.com/services/warehousing-distribution.
What You Get with All Points
Custom kitting with return-ready packaging and branded inserts: We design kitting and packout anticipating returns by incorporating resealable bags, scannable RMA labels, and clear, brand-aligned instructions that reduce damage rates and return errors. Explore: https://www.allpointsatl.com/services/kitting-assembly.
Full ecommerce fulfillment capabilities tailored for high-return SKUs: Categories like apparel, footwear, electronics, and cosmetics are managed with category-specific grading and hygiene SOPs integrated into daily staffing and workflow. See: https://www.allpointsatl.com/services/e-commerce-order-fulfillment.
Efficient warehousing and distribution with returns expertise: Dedicated returns cells, quarantine areas, recommerce preparation, and liquidation workflows operate within a disciplined WMS environment to maximize throughput and accuracy. Learn: https://www.allpointsatl.com/services/warehousing-distribution.
Printing and marketing materials to reduce avoidable returns: Size guides, setup cards, and QR-coded RMA instructions printed in-house enable timely, branded inserts that reduce confusion and returns incidence. Discover: https://www.allpointsatl.com/services/printing-marketing-materials.
Practical Implementation Checklist
Policy and Portal
- Define clear return windows, exclusions, fees, and abuse policies.
- Implement a self-serve RMA portal with mandatory reason codes and barcoded labels.
WMS and Data
- Map return dispositions and grading rules by SKU categories.
- Enforce consistent scanning and photo capture; use dashboards to monitor cycle time, recovery rates, and return reason codes.
Floor Design and Staffing
- Dedicate a specialized returns cell segmented by lanes, with clear signage and visual controls.
- Cross-train core teams; onboard seasonal temps in peak periods.
Materials and Packout
- Standardize polybag sizes, labels, and hygienic seals to streamline repack.
- Include outbound inserts with QR codes linking directly to sizing guides and RMA portals.
Recommerce Plan
- Create and price B- and C-grade SKU aliases with scheduled listings and liquidation cadence.
SLAs and Cadence
- Target dock-to-stock turnaround of 24 hours for A-grade returns.
- Complete 90%+ return processing within 48 hours.
- Host weekly liquidation or donation events and conduct monthly trend post-mortems on return patterns.
Operator POV: Where Brands Lose Money on Returns
Returns management commonly bleeds margin due to process failures:
- Offering free returns without guardrails inflates costs. Prioritize free exchanges first and use “keep it” policies for low-value items to avoid reverse freight and double handling.
- Failing to analyze return rates by size or style leads to repeated customer dissatisfaction and excess returns.
- Bundles missing spare components cause losses; maintain component SKUs and perform daily re-kitting to avoid shipment mistakes.
- Marketing-driven return policies without operational input create unscalable workflows and hidden labor spikes that increase cost unpredictably.
Putting framework, data, and controls in place safeguards profitability and helps scale operations confidently.
FAQ
Q: How long does it take to process a return?
A: With disciplined intake and a dedicated returns cell, most returns complete inspection and dock-to-stock within 48 hours. A-grade items aim for a 24-hour turnaround.
Q: What SLAs do you hold for accuracy?
A: We maintain ≥ 99.5% accuracy for return check-in and condition grading, supported by barcode scanning and photo documentation.
Q: How does automation lower return costs?
A: Automation reduces manual back-and-forth ticketing, speeds inspections, minimizes human error, and lowers per-unit labor through efficient rule-based workflows.
Q: Can All Points handle recommerce or liquidation?
A: Yes, we create B/C-grade SKU aliases, prep open-box units, and coordinate weekly with recommerce or liquidation partners to maximize returns recovery and reduce stockpile risk.
Q: What’s the Atlanta advantage for returns?
A: Our Atlanta location provides two-day transit to roughly 80% of the U.S., accelerating inbound returns and outbound exchanges while reducing reverse freight zone cost and transit delays.
Call to Action
Talk to an Atlanta 3PL expert. We’ll design a returns workflow, SLAs, and floor plan customized to your SKU mix and volume. Contact us to get started: https://www.allpointsatl.com/contact.
Secondary: Download the 3PL Guide to learn more about optimizing your order-to-ship lifecycle: https://www.allpointsatl.com/resources/3pl-guide-for-e-commerce-and-amazon-sellers.
About All Points
All Points is an Atlanta-based, family-owned 3PL founded in 1995. We provide end-to-end logistics—from custom kitting and ecommerce fulfillment to warehousing, distribution, and printing—ensuring your brand ships accurately, on time, and at scale.
Disclaimer: This article is intended for informational purposes only. All Points Packaging & Fulfillment does not guarantee specific results and encourages consultation with logistics professionals to tailor solutions to your unique business needs.
Additional Reference Links for In-Depth Insights
Returns Management: Reshaping Retail Profitability – ReturnPro: https://www.returnpro.com/resources/blog/returns-management-reshaping-retail-profitability
How to Turn Returns Into Profits – Radial: https://www.radial.com/eur/insights/how-to-turn-returns-into-profits
Smart Product Returns Management – K38 Consulting: https://k38consulting.com/smart-product-returns-management/
The Relationship Between Profitability and Returns Management – Reveni: https://www.reveni.com/blog/the-relationship-between-profitability-and-returns-management
Returns Management Process – Sage: https://www.sage.com/en-us/blog/returns-management-process/
Conclusion
Learn how to turn returns from a costly burden into a profit-driving process. This guide covers scalable reverse logistics, automation, data insights, and recommerce strategies tailored for DTC brands and retailers to reduce waste, speed fulfillment, and recover value efficiently at scale.

.webp)
.webp)
.webp)
.webp)


